
Up until just two decades ago, collecting any kind of data about the earth using a sensor device was a very precious thing. Collecting this data helped us to understand changes across very large areas. The data especially made a significant impact in the farming industry, particularly with land management, water/chemical usage, yield estimations, and protection from floods/diseases.
As embedded systems, sensor technologies and software development advances, we are entering a new age of data collection. I will call it the Big Data Decade. Gone are the days when people searched for a single piece of sensor data about the earth. We are now overwhelmed by an increasing amount of data from satellites, drones, smartphones, smartwatches, ground sensors, tractor computers and so on. For every piece of land, these data collection resources are increasing exponentially. Business Insider magazine has depicted this exponential increase for us, showing the average number of IoT device shipments from Amazon to agricultural companies every year (Figure 1) and the average number of data bits collected per farm per day (Figure 2). Big data is getting dramatically bigger.
The problem we face today is, how do we select the relevant information, and how do we fuse these different data sources together to extract new meanings from the information. If we cannot analyse this data well, we expose ourselves to the risk of spending unnecessary time/space/energy trying to process this overwhelming amount of potentially repeating and redundant information. On the other hand, very crucial information might go unrecognized in the clutter of information.
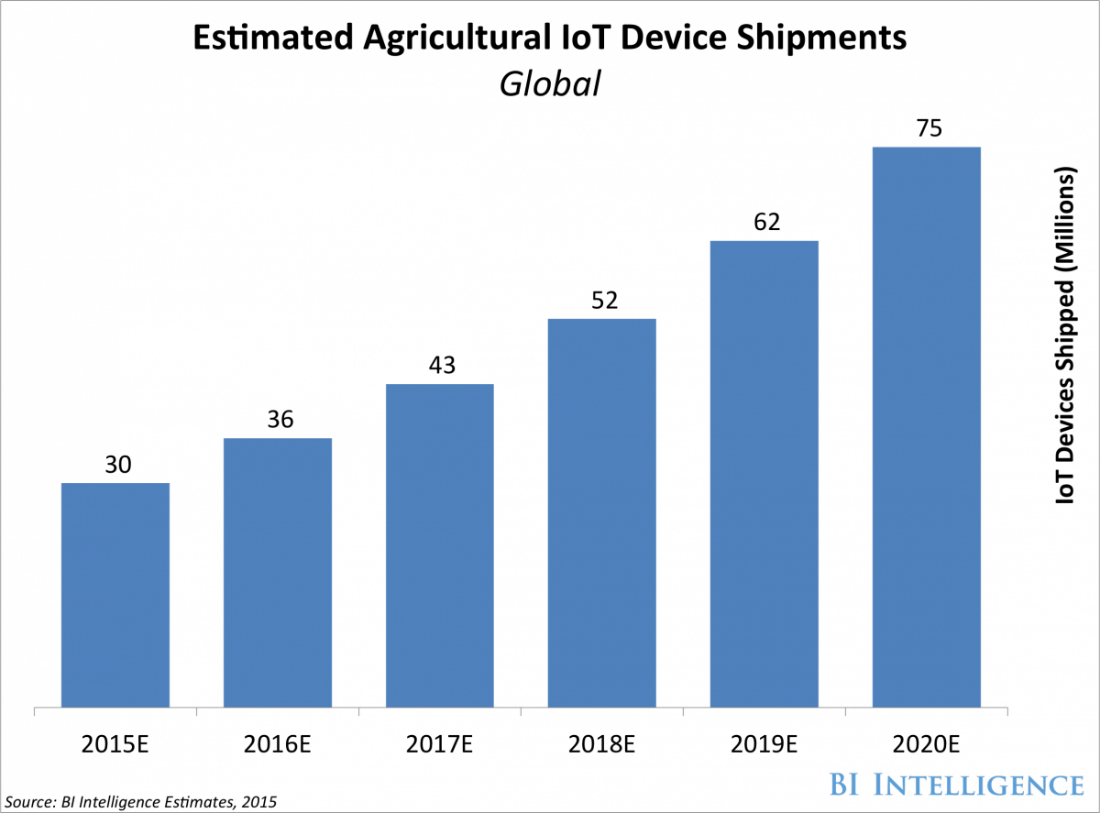
Figure 1: Average number of IoT device shipments from Amazon to agricultural companies per year
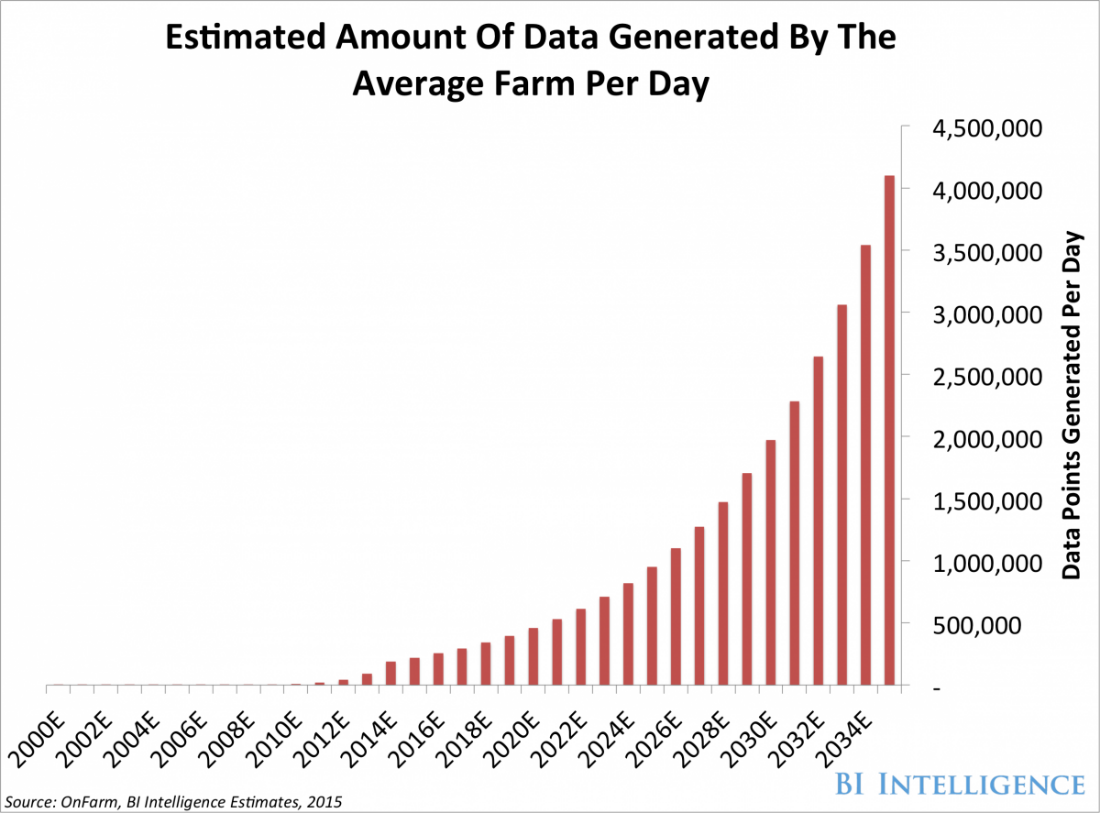
Figure 2: Estimated amount of data (bits) generated by an average farm per day by year
Tragedy or Opportunity?
So we don’t turn opportunities into tragedies, I want to illustrate the three major challenges faced with collection of big data these days. These three ‘V’ challenges are; Variety, Velocity and Volume. Variety underlines that the data that we collect from different resources are in different formats and different policies (for instance one data could be a bi-weekly updated free image, one data could be hourly changing humidity, and one data could be an excel sheet from a paid service). Velocity underlines that the data we collect have different acquisition frequencies and also different historical backgrounds. Finally, Volume underlines the difficulty with handling the data size, and selecting the smaller amount of data that is actually valuable in that moment for communication.
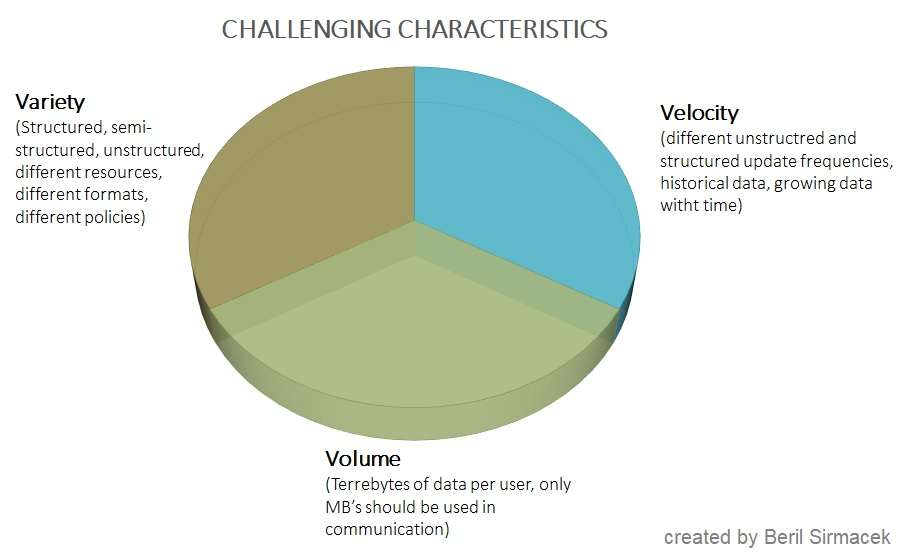
Figure 3 Three major challenges of handling big data
As Albert Einstein said “We cannot solve our problems with the same level of thinking that created them”. Therefore, I suggest we shift our perception from the tragedy of overwhelming data clutter, towards the facilities we have available in our Big Data Decade. Let’s look to the opportunities! Until this decade, mathematicians and software developers acted as though they were living in completely separate worlds, surrounded by thick walls. However now, software developers know that they should learn from the mathematical facts. They should implement better algorithms in order to reduce the amount of redundant information and extract the valuable characteristics from big data. This new attitude helps us to solve the Variety challenge. Until this decade, cloud computing opportunities were not easily accessible and widely available for business. However now, clouds solve our Volume challenge. Until this decade, we didn’t have many interface opportunities, such as satellite (or other sensor data) API’s. However now, different data services provide API’s that enable us to interface data automatically, even if they are generated in different Velocity.
I believe that future of farming will be in the hands of satellites, ground sensors, drones and robots. The task of the farmer will be to monitor the information with augmented/virtual/mixed reality and spend time on high-level decision-making processes. Spending time with details such as visual inspection of diseases and searching for right treatment options will no longer be required.
Welcome to the big data decade!
Read on for more detail about how to deal with the three Vs!
Some example approaches for dealing with three ‘V’ challenges of big data
For dealing with variety, we can use mathematical tools. Dimensionality reduction methods such as principle component analysis (PCA) are very useful for reducing the complexity of dealing with multiple data sources. As illustrated in the example given in Figure 4, if there are 3 data resources, they would generate 3-dimensional data. However, these 3 data resources need a large amount of storage space and they create high complexity for the classification algorithms (such as detecting weeds or other interesting classes). PCA transforms the 3-dimensional space into a new component space, where less information can be helpful for identifying different classes easily. This method can be applied to N-dimensional data in the same way (even though we cannot draw an illustration of an N-dimensional space), and it helps to transform various data into a new simplified space, where the classification algorithms can work.
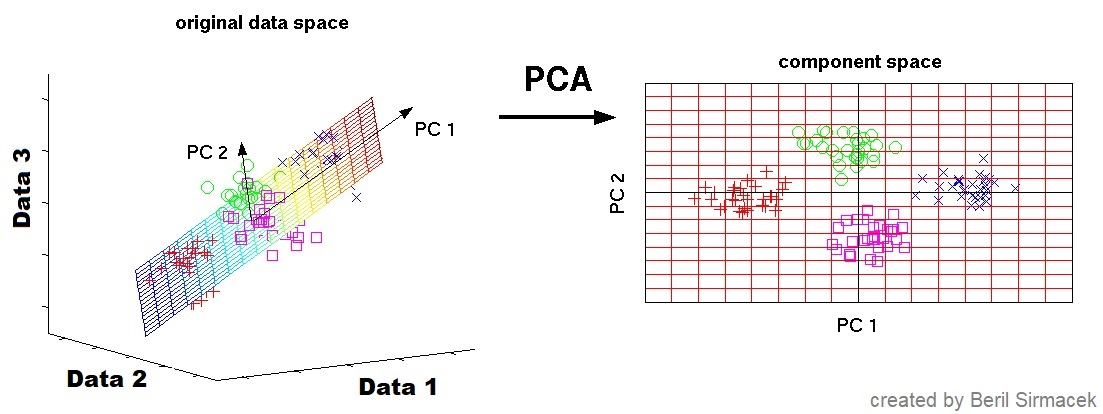
Figure 4: Illustrating a dimensionality reduction example using PCA
To deal with volume, we can look to an example. The volume challenge can be solved by the geoTAG visualization application of farmAR app. Using cloud computing facilities of our own (Figure 5), our company farmAR generates augmented tags (only latitude, longitude information and the class label) for the earth locations that need urgent attention (Figure 6). Instead of transferring terabytes of satellite data to the end user, we transfer only few bytes of data that the user can use and benefit from.
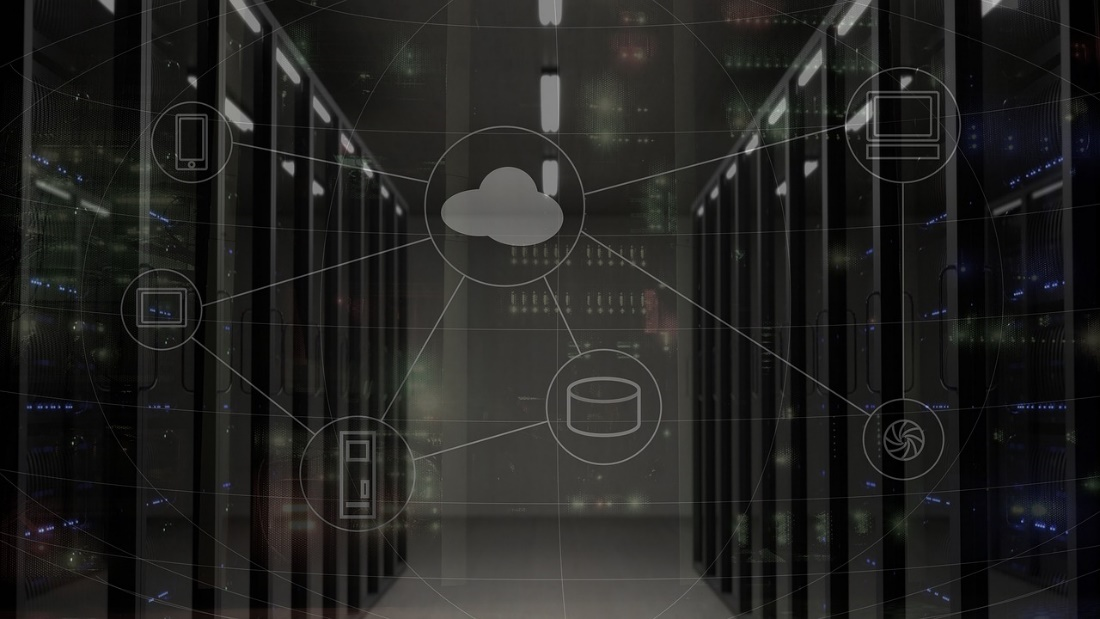
Figure 5: A representation of a cloud computing server station
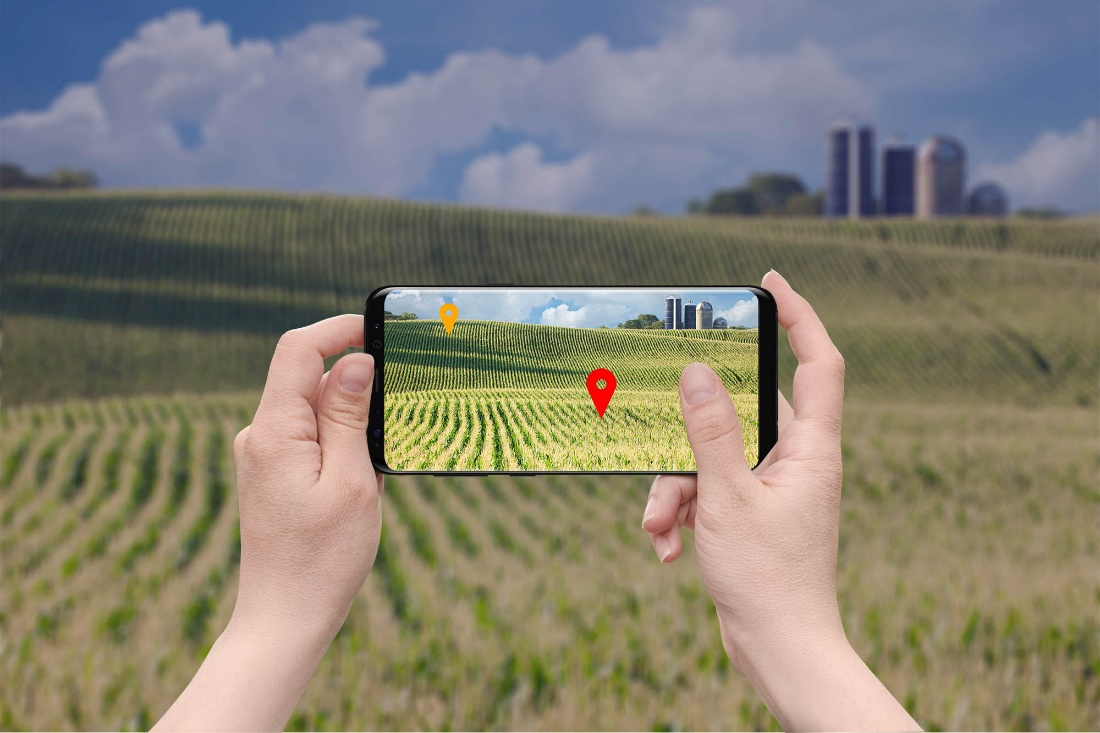
Figure 6: Augmented geoTAG display of farmAR reduces the challenge with dealing high volumes of big data
For the final ‘V’ challenge, we found out that the best way to deal with different data velocity is to benefit from API developments of different data sources. The API functions allow us to be notified when there is new data acquisition for a certain area. Therefore, the cloud computing algorithms can be automated to execute certain processes, even when different data sources send updates in different frequencies.
Welcome to the new world which is beyond 3D and which is beyond visible!
About Beril Sirmacek:
Beril holds Dr.-Eng. Degree in Computer Science, and as the inventor of the farmAR framework, she serves as CTO at farmAR. She also develops software and teaches at the Robotics and Mechatronics Department of University of Twente. As a finalist of the Copernicus Masters DLR Health, Energy and Environment Challenge 2016, company create4D was accelerated through the Copernicus Accelerator and in 2017 she won the Copernicus Masters B2B Challenge with her co-founded company farmAR. She is enthusiastic about creating useful software services for everyday life, based developments in remote sensing, big data, deep learning, AI and augmented reality fields.


